8.11 网络图 EMP_network_plot
模块EMP_network_plot可以将网络分析的结果绘制成可视化图形。 本章节可以结合6.12一起参考。
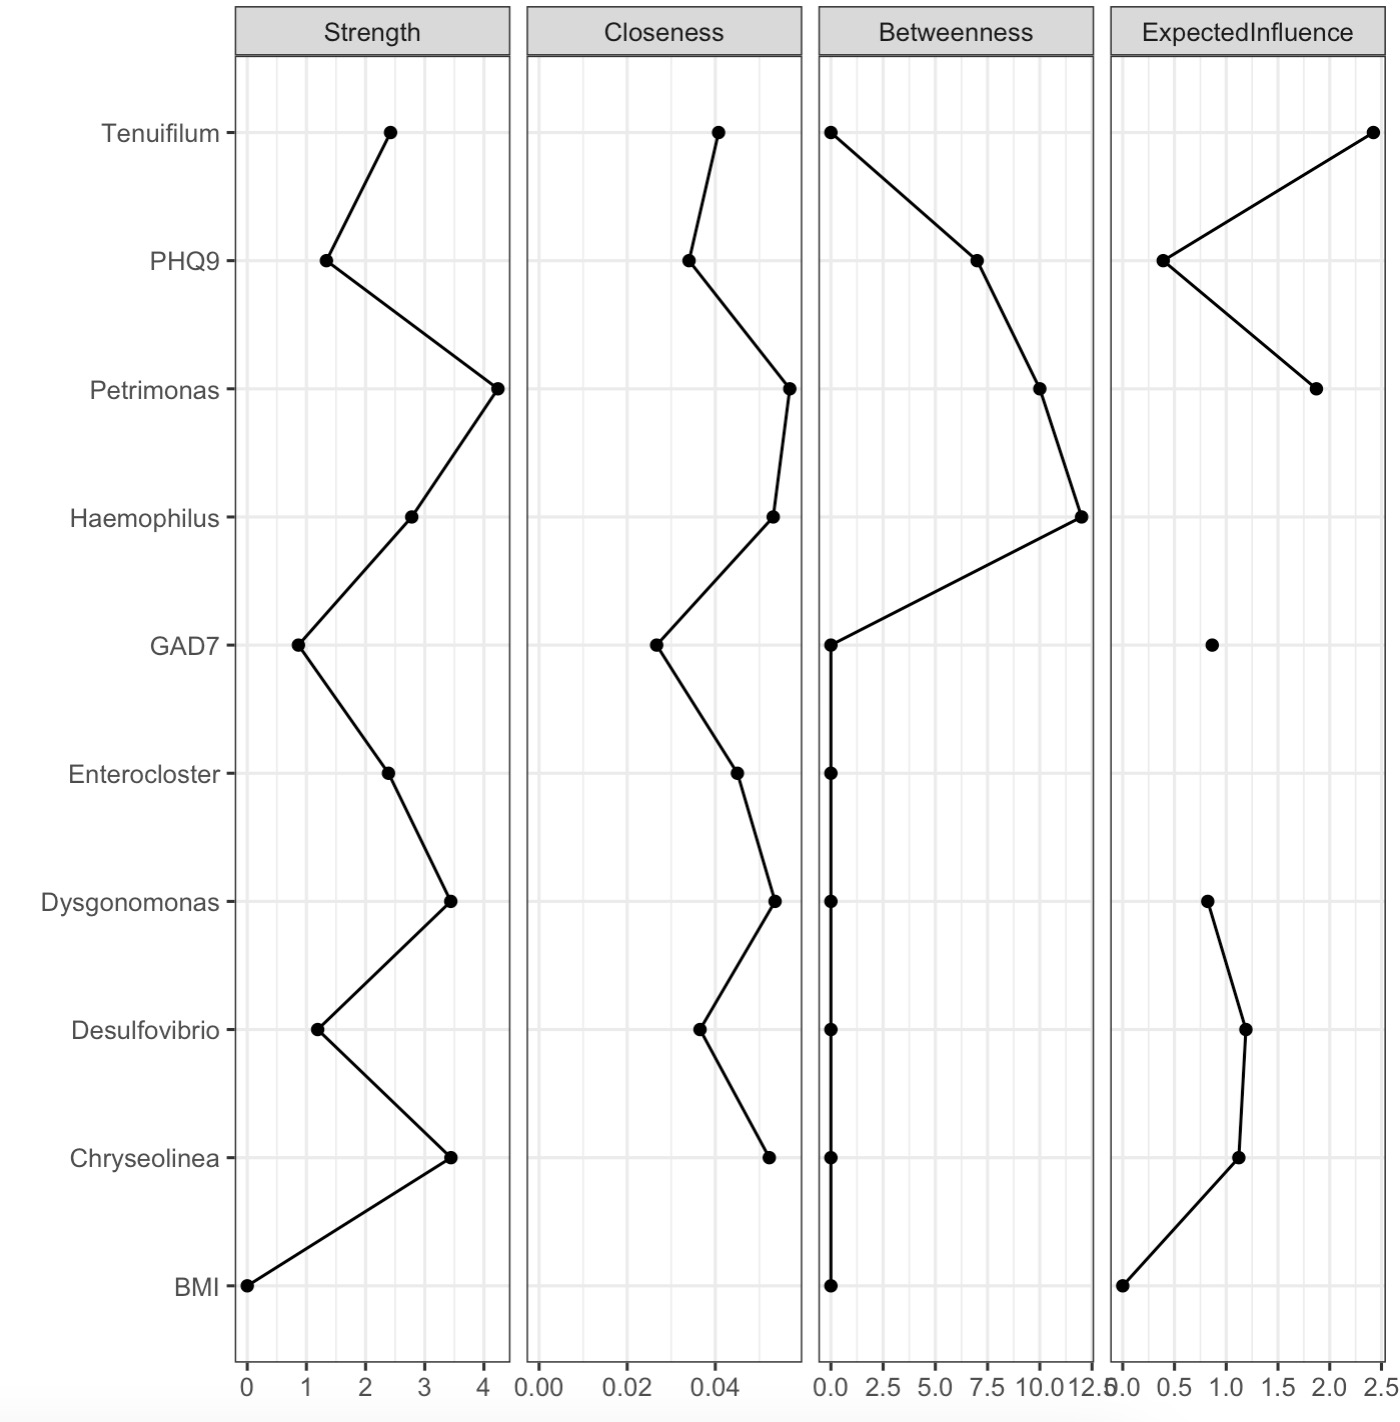
8.11.1 节点重要性图
注意:
参数
参数
show选择显示节点还是网络。🏷️示例:
MAE |>
  EMP_assay_extract('taxonomy') |>
  EMP_collapse(estimate_group = 'Genus',collapse_by = 'row') |>
  EMP_diff_analysis(method='wilcox.test', estimate_group = 'Group') |>
  EMP_filter(feature_condition = pvalue<0.05) |>
  EMP_network_analysis(coldata_to_assay = c('BMI','PHQ9','GAD7')) |>
  EMP_network_plot(show='node')
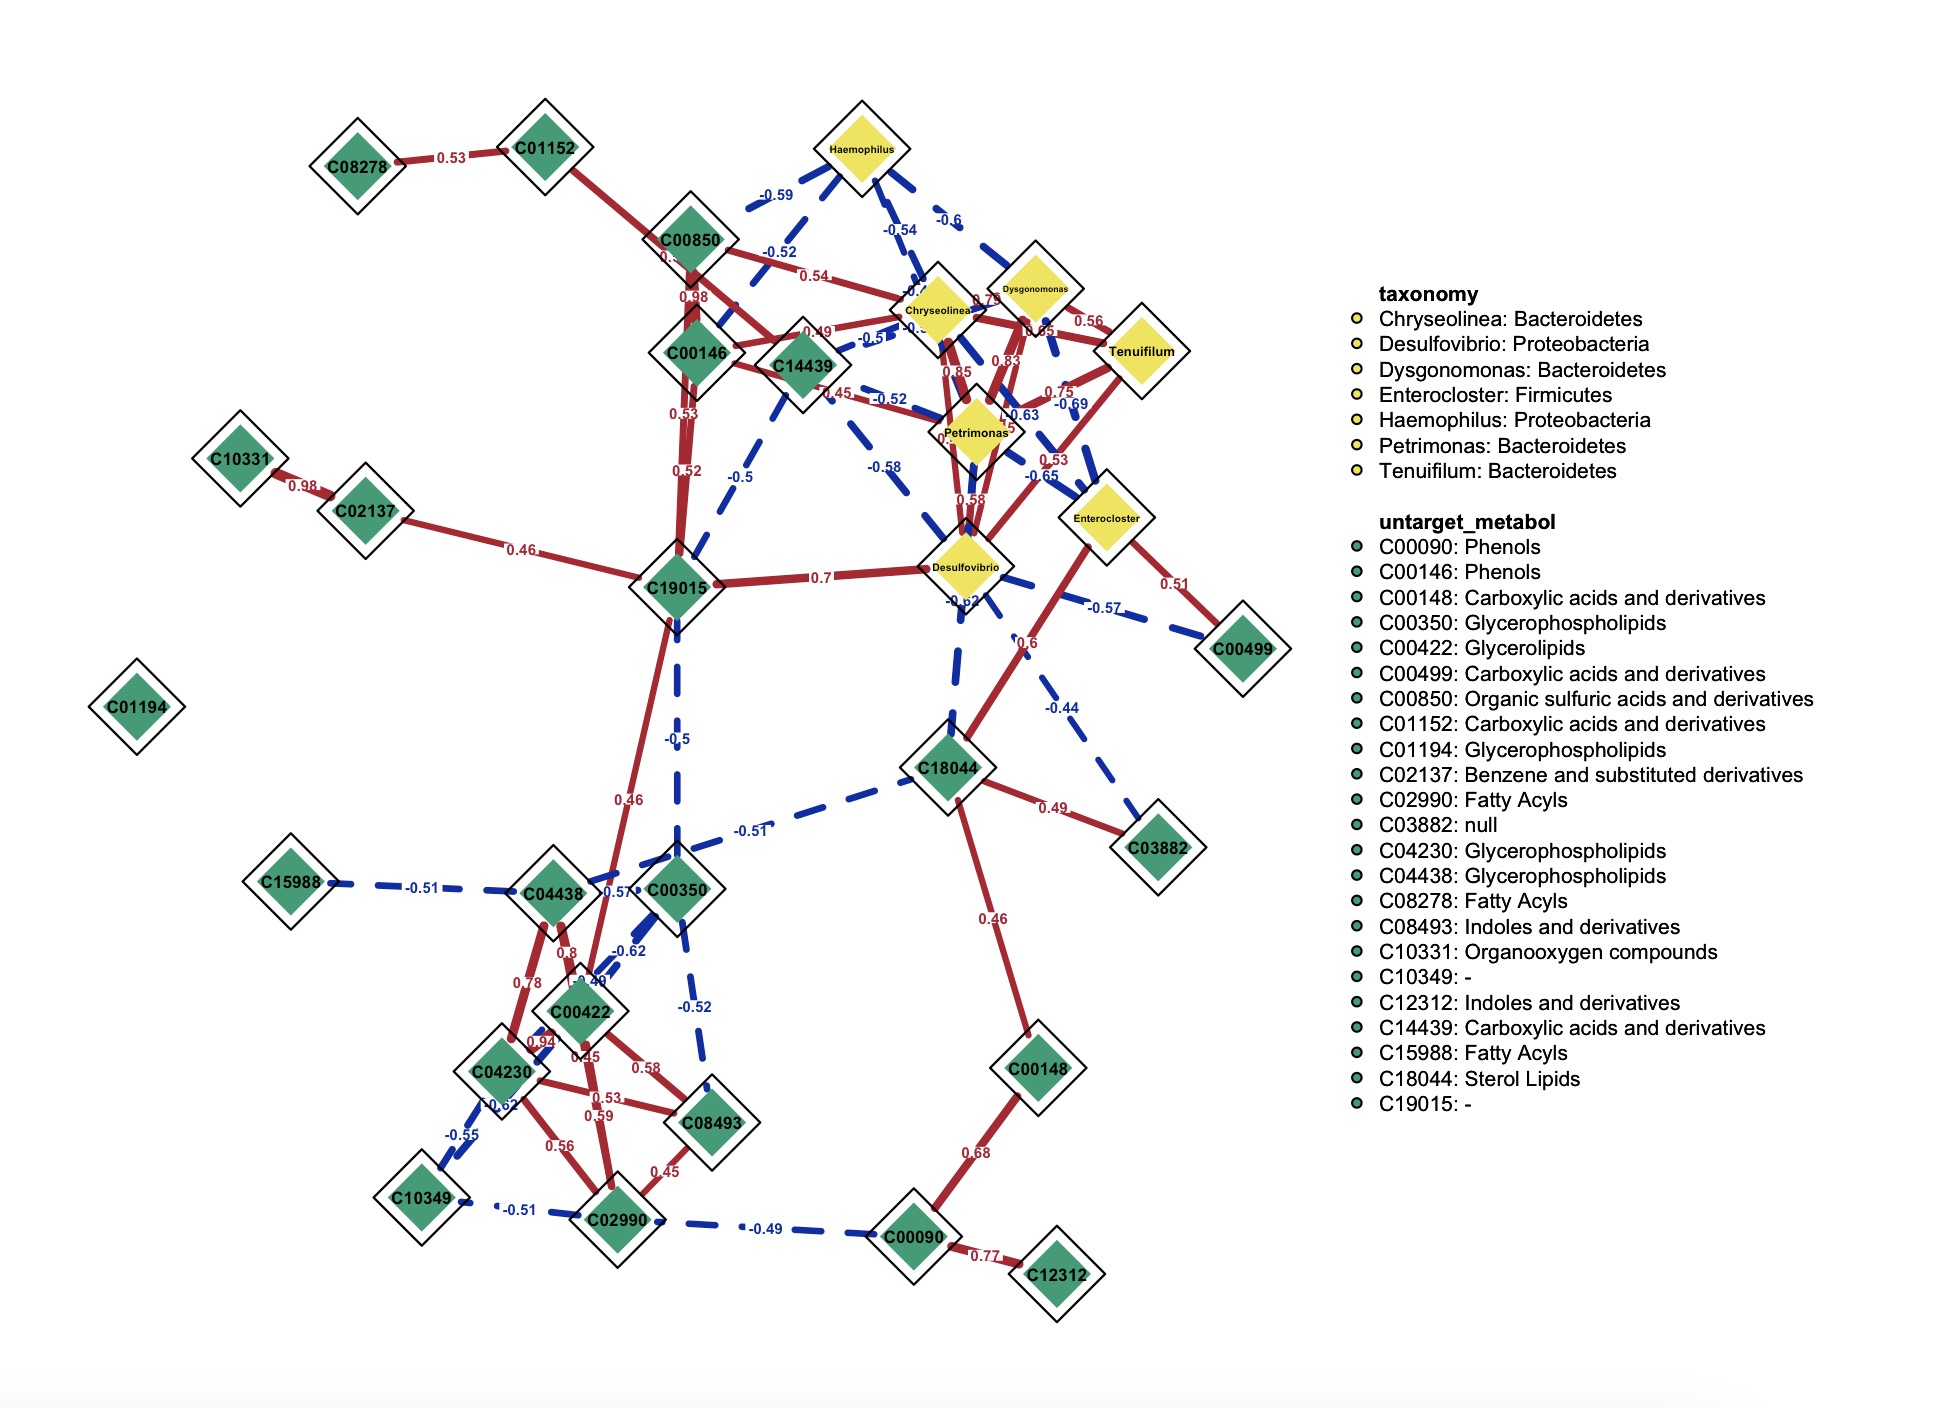
8.11.2 网络互作图
注意:
本模块继承了qgraph的参数用法。
本模块继承了qgraph的参数用法。
🏷️示例:
k1 <- MAE |>
  EMP_assay_extract('taxonomy') |>
  EMP_collapse(estimate_group = 'Genus',collapse_by = 'row') |>
  EMP_diff_analysis(method='wilcox.test', estimate_group = 'Group') |>
  EMP_filter(feature_condition = pvalue<0.05)

k2 <- MAE |>
  EMP_collapse(experiment = 'untarget_metabol',na_string=c('NA','null','','-'),
               estimate_group = 'MS2kegg',method = 'sum',collapse_by = 'row') |>
  EMP_diff_analysis(method='DESeq2', .formula = ~Group) |>
  EMP_filter(feature_condition = pvalue<0.05)

(k1 + k2 ) |>
  EMP_network_analysis() |>
  EMP_network_plot(show = 'net',layout = 'spring',
                   shape='diamond',
                   edge.labels=TRUE,edge.label.cex=0.4,
                   vsize = 5,threshold = 0,
                   node_info = c('Phylum','MS2class'),
                   legend.cex=0.3,label.cex = 1,label.prop = 0.9,font=2)